Whole brain mapping of a sensorimotor response in the zebrafish… Novel optogenetics combination to control select cells in deep brain tissue at high resolution… Instability of neurons during stable song behavior in songbirds…
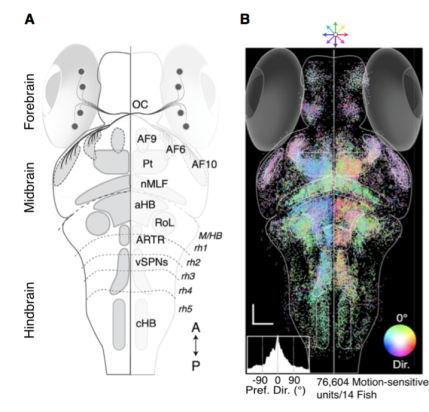
Whole-brain optogenetic mapping of a visual sensorimotor behavior in the larval zebrafish.
Mapping the interactions between neurons across numerous anatomically distinct brain regions is one of the main priorities of the BRAIN Initiative. This will provide a more comprehensive understanding of how the brain works. Previous studies in invertebrate animals, such as the fruit fly and the nematode, established the utility of these smaller model systems for recording and mapping complex interactions of neurons during behaviors. However, scaling up to the larger central nervous systems of vertebrate animals is difficult due to the orders of magnitude increase in cell numbers and complexity. In a recent article published in Cell, Dr. Florian Engert and colleagues used 2-photon calcium imaging to map neuronal responses across the entire zebrafish brain. First, the researchers created a computational model of sensorimotor responses based on larval zebrafish swimming behaviors elicited by a series of stimuli moving across the whole visual field. Approximately one-hundred thousand neurons can be simultaneously optically imaged in the translucent larval zebrafish brain, allowing investigation of the functional connections between different brain regions responsible for the observed complex swimming behaviors. The researchers found that a great deal of the brain became activated during the optomotor response to the motion stimuli. Comparison of the activity recorded within a given region of the brain to the computational model provided a neurological map of how the visual sensory signal is transformed into a motor output. By combining these models with a series of lesion experiments, the researchers confirmed that particular regions, including retinal arborization field 6, the pretectum, and posterior commissure, were necessary for the sensorimotor transformation. The use of whole-brain neuronal imaging within ever larger vertebrate model systems will enhance our ability to explore interactions between brain regions during increasingly complex behaviors.
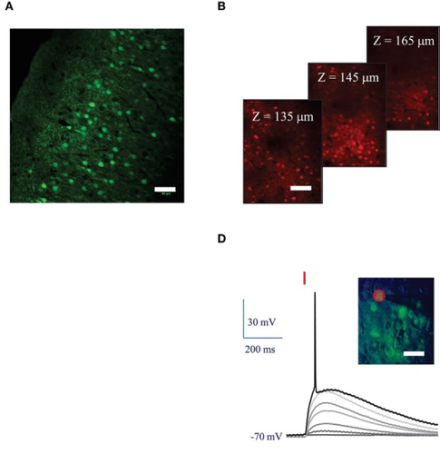
Establishing stimulation parameters for red-shifted opsin, ReaChR, using 2-photon imaging to control cellular activity in deep brain structures.
Optogenetics, which enables activation or inhibition of select neurons via genetically incorporated light-sensitive ion channels, has dramatically enhanced our understanding of the brain in a short period of time. To date, use of this technology has been limited to relatively superficial brain tissue, due to increased scattering of light within deep brain structures. Recent efforts suggest that red-shifted opsins that react to longer wavelengths of light may help overcome this technical challenge. BRAIN awardees Drs. Hongkui Zeng and Valentina Emiliani pioneered work combining 2-photon stimulation with the red-shifted channelrhodopsin, ReaChR. In their Frontiers in Cellular Neuroscience article, the research team characterized stimulation parameters using an amplified laser for 2-photon holographic stimulation of ReaChR in cultured cells in vitro, as well as in mouse visual cortex neurons in vivo. After achieving nanoampere-scale current generation by stimulating ReaChR, the group illustrated reliable action potential (AP) generation following 15-micrometer diameter light stimulation for 10-milliseconds to neurons expressing ReaChR. To manage latency and variability in AP generation, the investigators found that increasing the laser power density by a factor of 1.5 consistently elicits an AP with millisecond temporal resolution. Finally, the researchers successfully evoked repeated AP trains in ReaChR-expressing pyramidal and fast-spiking cells using 10 light pulses at a range of frequencies. This first demonstration of control of AP generation via 2-photon stimulation of red-shifted ReaChR with high spatial and temporal resolution offers a novel method to control targeted cells in deep brain circuits.
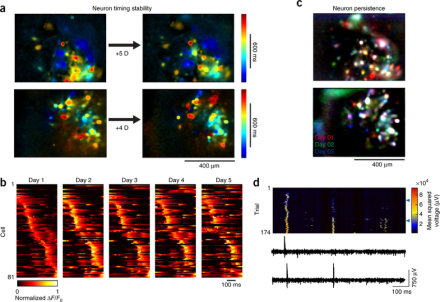
Excitatory neurons display variable activity during stable song production in zebra finches.
Recording neural activity over long periods of time to determine how circuit activity gives rise to behavior is an important goal of the BRAIN Initiative. BRAIN awardee Dr. Timothy Gardner and his laboratory recently developed minimally invasive carbon fiber arrays for long-term neural recordings. In an article in Nature Neuroscience, Dr. Gardner and his team used the carbon fiber arrays, as well as newly designed head-mounted, miniature fluorescence microscopes, to study neural activity in conjunction with song production in zebra finches. The song of the zebra finch exemplifies a stable behavior, where the precise timing and acoustic structure of a song is well-maintained, making it a useful model for studying dynamic neural activity during a stereotyped action. The team recorded from the premotor nucleus, called the HVC, which contains inhibitory interneurons and several classes of excitatory projection neurons. In previous experiments, activity of multi-unit ensembles, or local field potentials (LFPs), was stable over minutes and hours during song production. In these sets of experiments, Dr. Gardner and his team showed that during song, the activity of LFPs, and that of single-unit, inhibitory neurons, were highly stable over the course of days, weeks, and/or months. In contrast, individual, excitatory projection neurons exhibited unstable activity over the course of days. Thus, the song motor pattern in the zebra finch and the activity of the HVC on the regional scale (i.e., LFPs) remained consistent, whereas individual excitatory projection neurons in the HVC drifted in activity patterns, including the probability of their bursting activity, and the likelihood of firing at all, during song. This study used novel recording and imaging techniques to demonstrate an important distinction between multi-unit and single-unit neural activity, as well as inhibitory versus excitatory neuronal activity, during a stable behavioral action.