

Researchers have created an expandable, open-source anatomical atlas of the entire zebrafish brain, called the Z-Brain, and mapped onto it whole-brain activity occurring during multiple behaviors
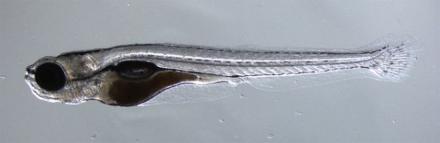
Knowing how each part of the brain contributes to a behavior is a primary goal of the BRAIN Initiative. Zebrafish offer an ideal platform for gathering this type of knowledge. Because the animal is small and its skin is translucent, the entire nervous system of the larval zebrafish can be seen under a microscope. Also, the larval zebrafish is capable of performing a variety of complex behaviors, including swimming, escape maneuvers, and hunting. These features make zebrafish amenable to the use of optical imaging techniques to link whole-brain activity to behavior.
While there is already a small number of calcium-based imaging paradigms for measuring whole-brain activity in zebrafish, these approaches either have poor spatial resolution or they impede naturalistic behaviors. On the other hand, tracking neural activity using the expression of immediate early genes, such c-Fos, is too slow—on the order of 15-30 minutes—to link activity to specific behaviors.
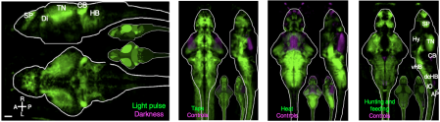
BRAIN Initiative awardees Florian Engert, Ph.D., a neuroscientist at Harvard University, and Alexander Schier, Ph.D., a molecular biologist at Harvard, have developed an imaging approach with a five-minute resolution that is based on detecting enzymatic activity resulting from the calcium influx that accompanies neuronal firing. Specifically, when a neuron fires, calcium entry activates the Ras-ERK pathway, leading to phosphorylation of transcription factors. The way that the method, described in a recent Nature Methods paper, works is that the researchers expose one-week-old zebrafish to a specific stimulus or engage the animal in some well-defined behavior, then immediately sacrifice the animal and use immunohistochemical staining techniques to detect levels of phosphorylated extracellular signal-related kinase (pERK) across the entire brain. This approach produces brain-wide maps showing the areas that were active during stimulus perception or during a given behavior.
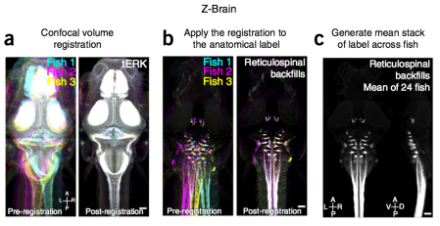
Whole-brain activity maps are of limited use if they cannot be tied to actual anatomical structures. The anatomical maps of the zebrafish brain that exist were derived from two- to four-day-old fish and represent the brain in only two dimensions. So, using high-throughput confocal imaging, the researchers created three-dimensional brain maps of nearly 900 individual zebrafish aged five to seven days. Then, using a combination of more than 20 transgenic labels and dye labels to identify specific brain structures, they were able to segment the brains into a 294 distinct regions. Finally, using a computational algorithm, they registered—or spatially aligned—the individual brains onto a single template brain, which they call the Z-Brain.
The Z-Brain is available as a web-based, open-source research tool. Also freely available at online is a Matlab program that lets users visualize the Z-Brain in a variety of ways. Researchers who use novel labels to visualize neural structures in the zebrafish brain are encouraged to upload their confocal images in order to expand Z-Brain.
Finally, overlaying whole-brain activity maps onto the Z-Brain revealed hundreds of areas associated with stimulus perception and the zebrafish’s various behaviors. Z-Brain and the pERK-labeling method for generating whole-brain activity will enable the zebrafish research community to tie neural activity involved in the perception of nearly any stimulus or the generation of nearly any behavior to distinct brain regions.